Cloudwatch Synthetics
May 20, 2020
By Tim Krupinski
Using Cloudwatch Synthetics with Private Endpoints
Introduction and Use Case
With the release of Cloudwatch Synthetics, AWS has added a powerful tool for organizations to leverage that was previously the exclusive domain of third party monitoring solutions. On its face, they serve to add visibility to publicly exposed endpoints, whereby a Lambda acts as a "user" consuming some part of an application.
While this is useful for traditionally-public types of applications, many Enterprises today have built robust capabilities that, due to compliance and regulatory compliance, are only accessible within small subsets of their corporate network.
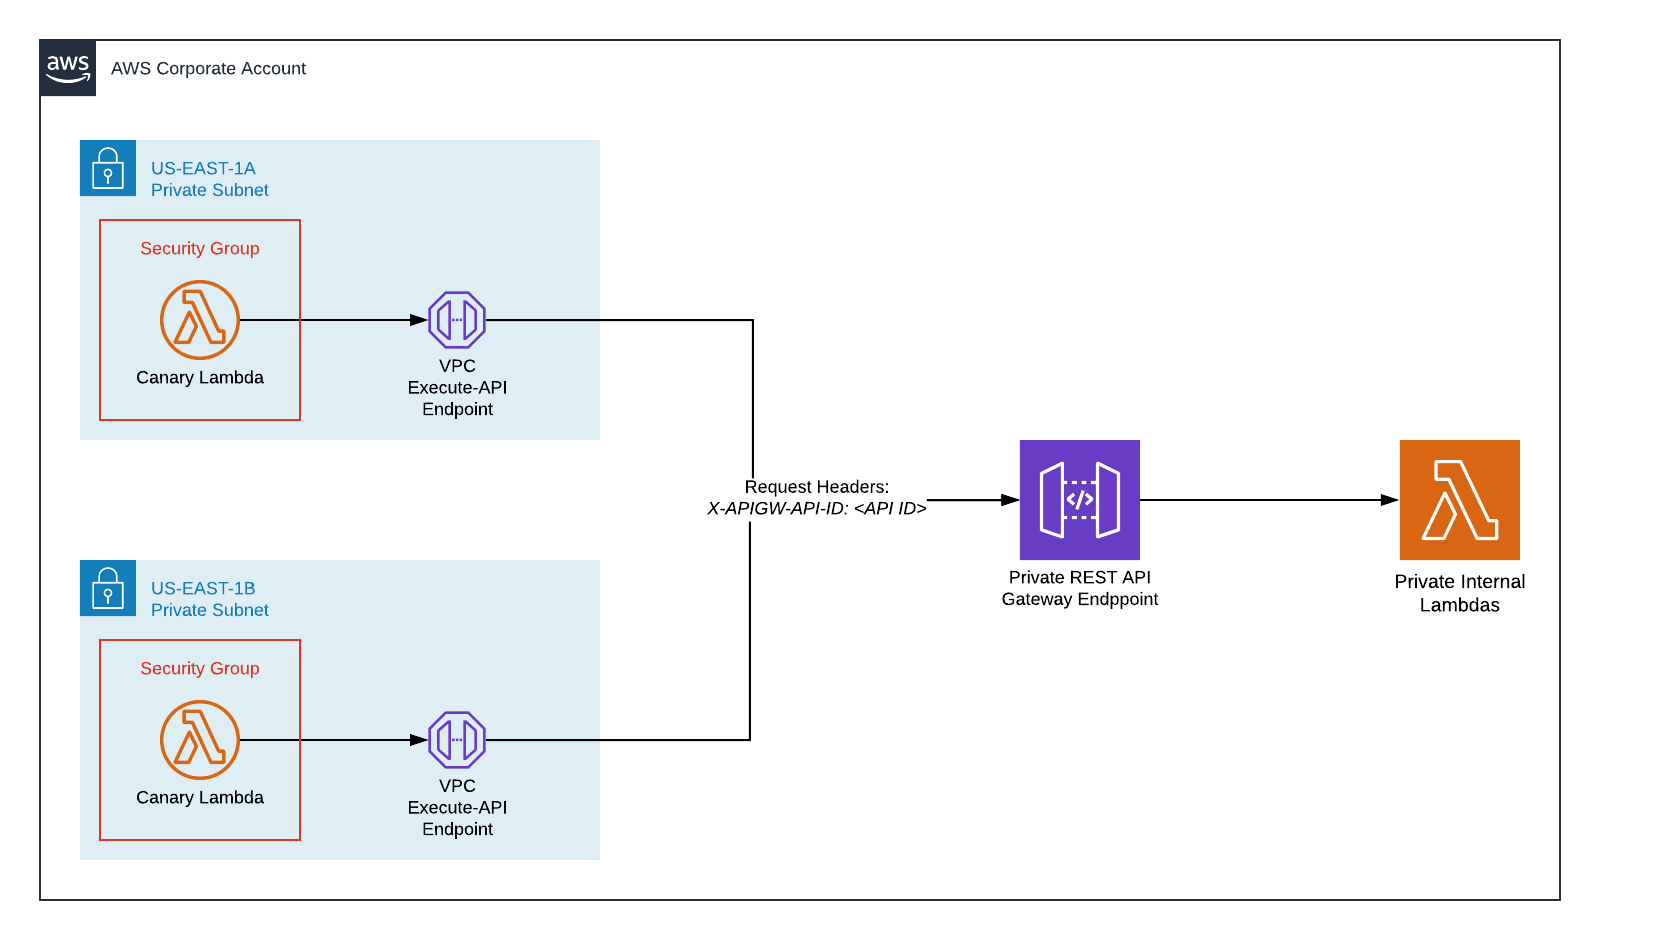
In this article, we'll take a look at how to leverage AWS Cloudwatch Synthetics using VPC endpoints that monitor an internal serverless application hosted on a private API Gateway.
Key Considerations for this approach:
- The use of VPC endpoints restricts all of our traffic to the internal AWS network.
- We are exposing a single API Gateway endpoint, but use the
X-APIGW-API-IDheader to delineate which lambda is invoked behind the gateway - Security Groups further restrict allowed traffic. In this case, a security group is created specifically for our Canaries, limiting egress to only our VPC endpoints
Before we set up our synthetic monitor, it is important for the reader to understand some of the terms and assumptions as part of this exercise.
What Are Synthetic Transactions
Synthetic Transactions go beyond simply measuring whether a web service is up or down. They also provide insight into specific, logical units of work that an application performs. They are designed to mimic what an actual user of the application would do during the course of their session.
For example, a synthetic transaction might attempt to query or insert random data into a database. If written correctly, calling this transaction not only tells you that a web server is available, but also that it can successfully connect to the database and perform insert operations.
In the event that any of the aforementioned steps failed, ideally the endpoint would respond with the relevant, non-200 HTTP code, along with a description of what failed.
We can also use timing data to gain insight into how software development has impacted our performance. By running the same transaction consistently, across version releases, it is easy to correlate releases with impacts to performance. Furthermore, it makes it easier to troubleshoot perceived performance impacts, as you can empirically assert performance characteristics between releases.
Pre-requisites
Before proceeding to the next section, ensure you have the following pieces of information.
Required Information
- The URL of the VPC endpoint exposing the APIs. Refer to the documentation for how to set up private VPC endpoints
- The ID of the API you intend to use
- The URI of the API
- The Subnets in which the API Endpoint is located
- A security group that allows egress on port 443 to the VPC Endpoint
Setup
With the information you collected in the last section, we can configure our canary. To start, navigate to the Cloudwatch console and select Canaries under the Synthetics section in the left navigation.
-
In the Create Canary page, select "Use a Blueprint" and the "API Canary" blueprint.
-
Fill in a name for your canary
-
For Method, we are using an
HTTP GET. However, you also have the option to useHTTP POSTand include a request body. -
For Endpoint URL, enter the VPC Endpoint URL, along with the URI for the API. E.G.
https://vpce-0333bf622cf2d1363-af7t5lpt.execute-api.us-east-1.vpce.amazonaws.com/dev/health -
For Key, enter
x-apigw-api-idfor the name, and the API ID in the value. -
Under Schedule, select Run Once.
You can leave the other values at their default setting for now. Click Save and wait for the canary to be created. The canary will run once, and will fail, because we still need to update the IAM Role to allow the Canary to describe network interfaces. Once that is done, we can then modify the canary to use a VPC and subnets.
-
Navigate to the IAM console and find your newly created role. It will be prefixed with
CloudWatchSyntheticsRole-. -
For demonstration, we can simply modify the attached policy to include the necessary EC2 permissions.
-
Add the following actions and save the policy
"Sid": "VisualEditor2",
"Effect": "Allow",
"Action": [
    "ec2:CreateNetworkInterface",
    "ec2:DescribeNetworkInterfaces",
    "s3:ListAllMyBuckets",
    "ec2:DeleteNetworkInterface"
],
"Resource": "*"
Private Endpoint Configuration
-
Go back to your Canary in the Cloudwatch console.
-
Under the Actions menu, select Edit
-
Scroll down and expand the VPC Settings. Fill in the details with the information you looked up for the VPC Endpoint
- Select the VPC in which your VPC endpoint resides
- Select the subnets in which your VPC endpoint is deployed
- Select a security group that allows traffic to the VPC Endpoint
-
Scroll up to the Schedule section, and select Run Continuously. Select an interval - currently health checks are scheduled to run on 5 minute intervals.
-
Save the canary.
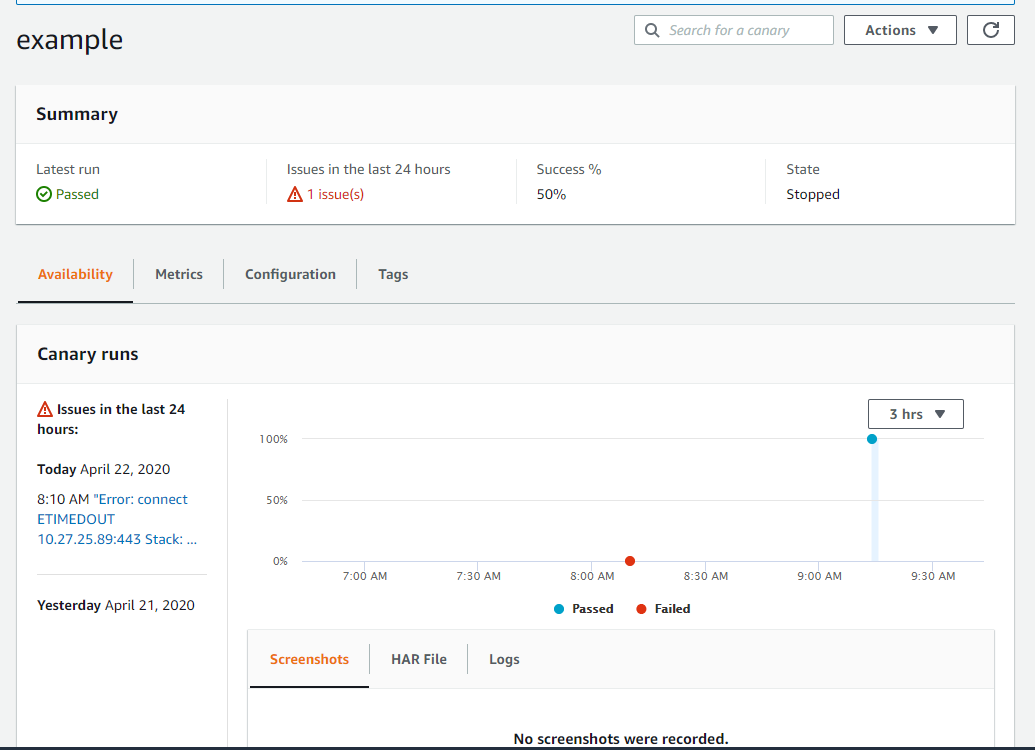
Once the Canary is saved, it will begin running on the interval you set. After a few minutes you should see the canary running successfully:
What you actually built
The Synthetics Canary is simply a wrapper that does the following things:
- Creates a lambda function with an existing AWS Synthetics layer in NodeJS
- Creates a bucket for logging
- Creates a new Cloudwatch Metrics namespace called CloudWatchSynthetics
- Cloudwatch Alarms (if you configured them in the GUI)
- An IAM role with a policy
The Synthetic Lambda
The lambda created as part of the Canary is mostly NodeJS boilerplate, with custom options automatically added from the data you supplied when you set up the canary.
There are two layers:
- Generic synthetic layer provided by AWS
- A custom layer dynamically built based on your configuration.
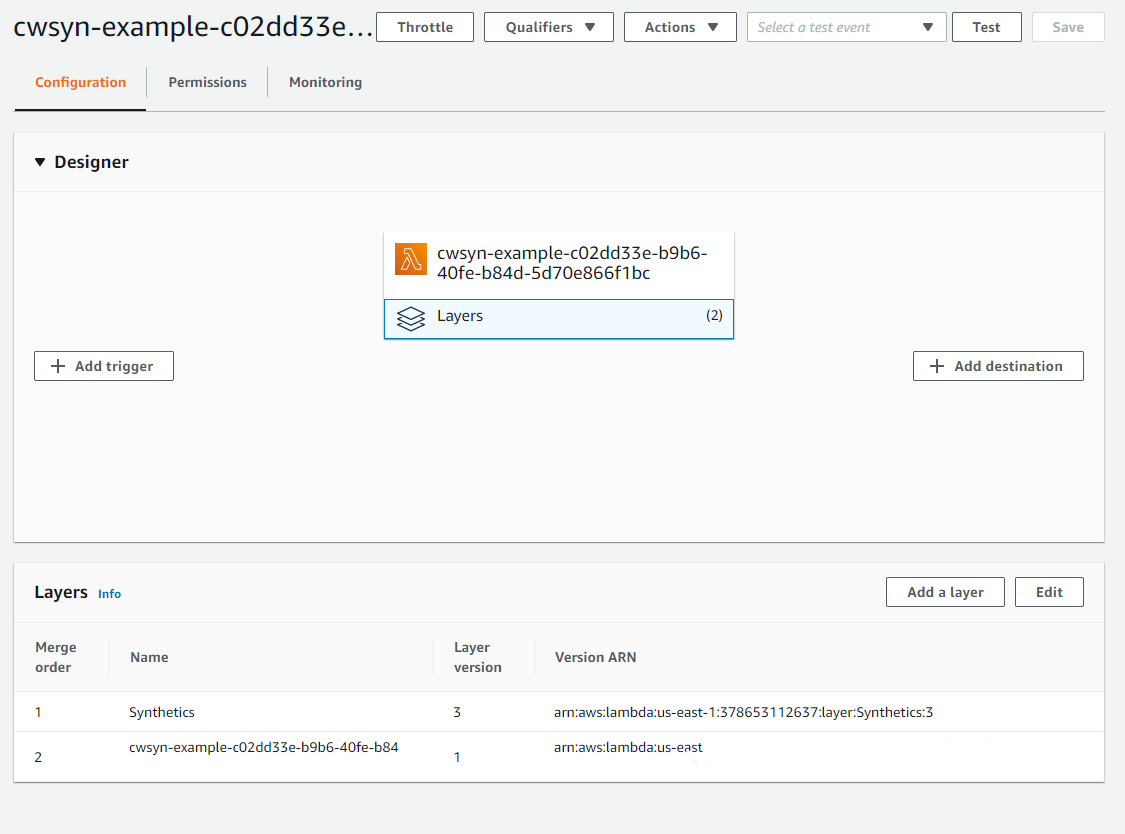
To find the code, navigate to the Lambda console and search for your canary. It
takes on a name of the form cwsyn-<canary_name>-<uuid>. The first layer is
standard across all canaries - it is maintained by AWS and bootstraps our function
to provide logging, custom metrics and handle failures.
To view the code in the custom layer, navigate to the Layers section in the left hand navigation. Search for the canary layer you created, which takes on the same naming structure as the function. Click "Download" and open it in an editor.
You also have the option of exporting the function as a SAM model, which you can customize to fit your needs.
Custom Metrics
As part of using the Synthetic Canary, custom metrics will be emitted to a new namespace called CloudWatchSynthetics. The two dimensions available are on a per-canary basis, as well as an aggregate across all canaries.
Each canary has three metrics:
- Duration
- Failed
- Success Percent
It is important to note that Failed values indicate a non-200 return code, and are not measuring the failure of the lambda service itself.
Alarms & Thresholds
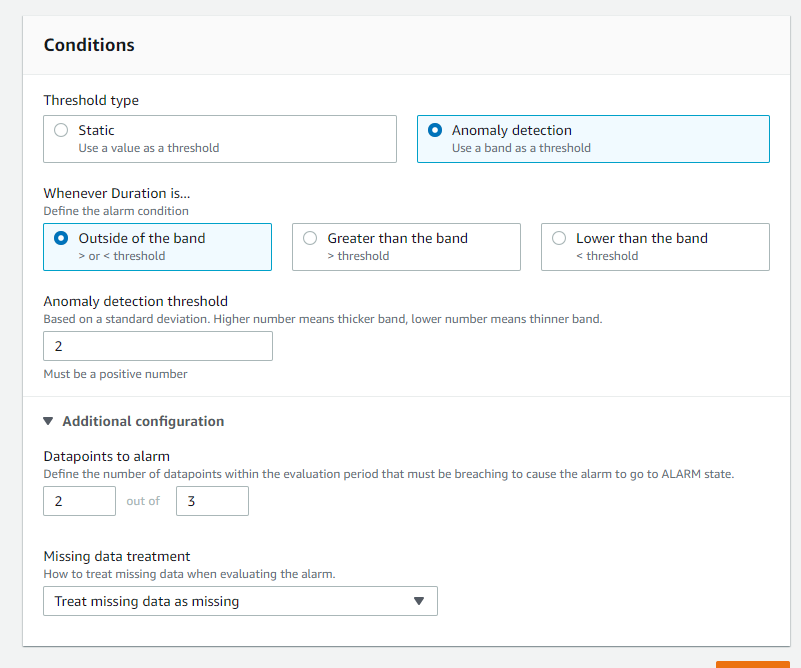
Configuring an alarm based on static thresholds is common, and outside the scope of this document. However, a useful new feature in cloudwatch called Anomaly Detection can be set on the Duration metric, and you can configure alarms based on that.
Anomaly Detection is a form of machine learning that trains itself on up to two weeks of data points. It is useful for detecting deviations from expected behavior, which is calculated based on past results.
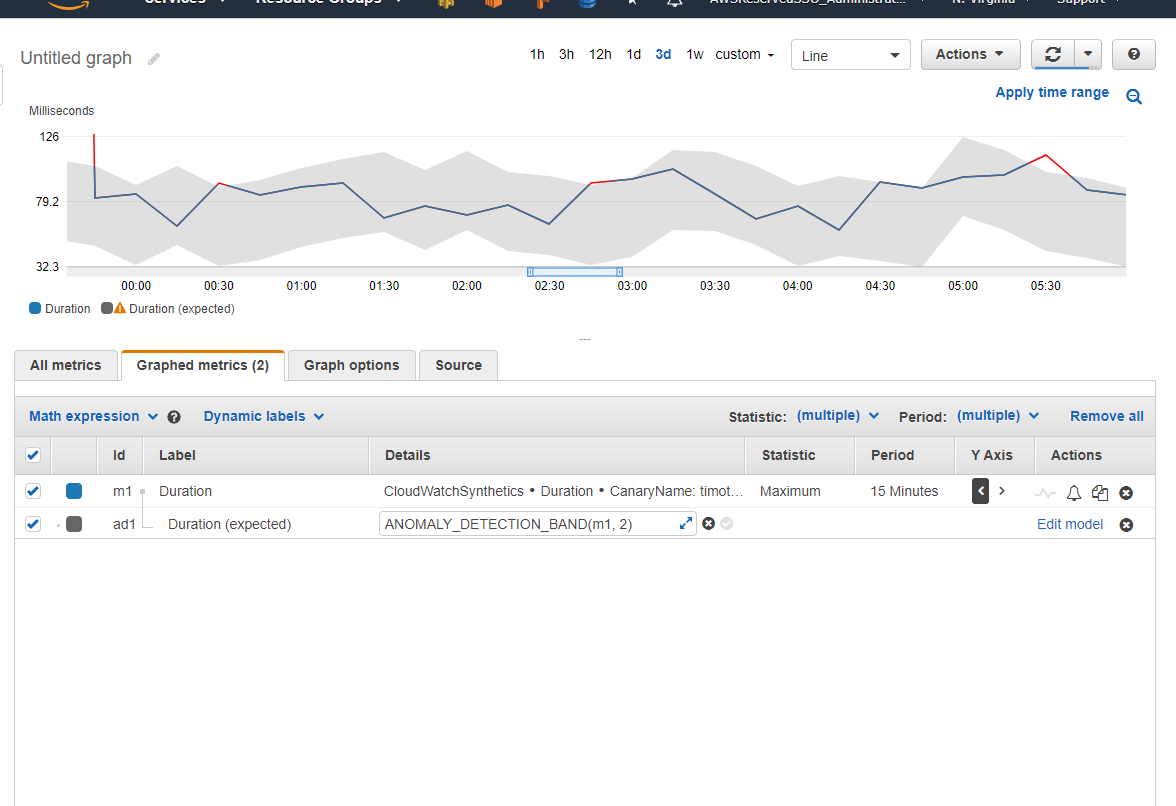
To configure useful anomaly detection in Cloudwatch, graph your Duration metric,
and select Maximum for the statistic. Set the period to 15 minutes. Add
Math Expression->Anomaly Detection->Calculate Band. You'll see a new row with
an expression similar to ANOMALY_DETECTION_BAND(m1, 2)
The first value is a reference to the metric you are using. The second value is the number of standard deviations from the mean in which to qualify a value as falling either within or outside of the detection band.
To get an accurate anomaly band, you must allow the model to train on data for several days, up to a week. When you first configure this, you will likely see an ultra-wide band. For example, with just a handful of data points running around 60-80ms, the band went from -30seconds to 30seconds. Over time this becomes more precise, and should eventually look similar to the following screenshot.
 .
.
Handling Cold Starts
Due to the Lambda architecture, occasionally your health check will run much longer than normal. To help filter these out, be sure to set the period of your graph to an interval that includes more than one sample. For instance, in this example, our health check runs on a 5 minute interval, and we are graphing with a period of 15 minutes.
Combined with a Cloudwatch alarm configured to activate if it detects multiple data points in a row, this can help to avoid false positives that are due to cold starts.
Conclusion
Here, we've successfully configured a Cloudwatch Canary to monitor an application health check on a fixed interval, and only raise an alarm when response times are considered outside of the expected "normal", which also serves to reduce alarm fatigue on an operations team.
We also saw how the Cloudwatch Console can be used to automatically generate boilerplate code for us to use, along with custom metrics. An operator need not have a background in NodeJS to leverage this capability.
Provided that an application has relevant health checks built into it, over time, this information can be used to ascertain performance characteristics and trends over time.